


The main application of FTIR to proteins has been the detection of relative conformational and structural changes induced by thermodynamic, chemical or biological perturbations [1-3]. However, it can also be used to quantify the concentration of standard solutions. Analysis of aqueous protein solutions presents a classic set of problems around sensitivity to the protein content versus the water in the sample. Multiple reflection ATR offers the required sensitivity without needing large quantities of sample: as little as 10 μl of sample is sufficient. To demonstrate this, we show example of bovine gamma globulin, looking both at quantification and analysis of secondary structure changes under thermal perturbation.
Quantification using protein standard solutions
Standard solutions of bovine gamma globulin (BGG) from 125 µg/ml to 2000 µg/ml were prepared and analyzed using the ConcentratIR2 with a silicon ATR crystal. The Amide I and II bands were observed at circa 1620-1660 cm-1 and 1540 cm-1, respectively. The Amide II band was used to construct a plot of concentration versus absorbance (see figure below) that would enable the concentration of unknown samples to be evaluated.

Detecting changes in secondary structure
750 µ/ml BGG in solution with 0.9% NaCl and sodium azide was injected into a temperature controlled cell fitted on top of the ATR. The temperature of the cell was maintained at 100°C throughout. Spectra were acquired in one-minute intervals to observe the changes in protein secondary structure due to exposure to the high temperatures within the cell.
A decrease in intensity for the band at 1660 cm-1 indicates a decrease in α-helix and the growth of peaks in the 1620-1640 cm-1 region shows a corresponding increase in β-sheet formation.

Further analysis of the secondary structure
Dr Shobhna Kapoor, Assistant Professor at the Department of Chemistry, Indian Institute of Technology Bombay used a Specac liquid transmission cell with a heating jacket to study the protein Ras [4]. This is a protein that is involved in cellular signalling to control aspects of its behaviour [5].
The amide bands in spectra of proteins are typically broad and relatively featureless. Various forms of deconvolution have been tried to elucidate further information on structural changes. One of the common methods is to take the second derivative of the spectrum. A second-derivative spectrum tells us how fast the slope of the spectrum is changing, and highlights local variations in spectral intensity that would otherwise be hard to interpret in the untreated spectrum [6].


Analysis of Amide I band for post-translationally modified N-Ras protein in D2O solution. Left to right, these show (a) normalized spectra (top) and difference spectra (bottom) for increasing temperature of the solution; (b) temperature-dependent second-derivative spectra of the protein solution; and (c) a quantitative fit analysis of the Amide I band showing the evolution of secondary structure with temperature.
The FTIR spectroscopy analysis showed that Ras proteins undergo substantial secondary structure changes (such as aggregation) following unfolding, leading to the formation of anti-parallel β-sheet aggregates with temperature. A protein state with locally unfolded structure and highly flexible helices was observed at temperatures above 60 °C.
Highly sensitive ATR for microvolume analysis
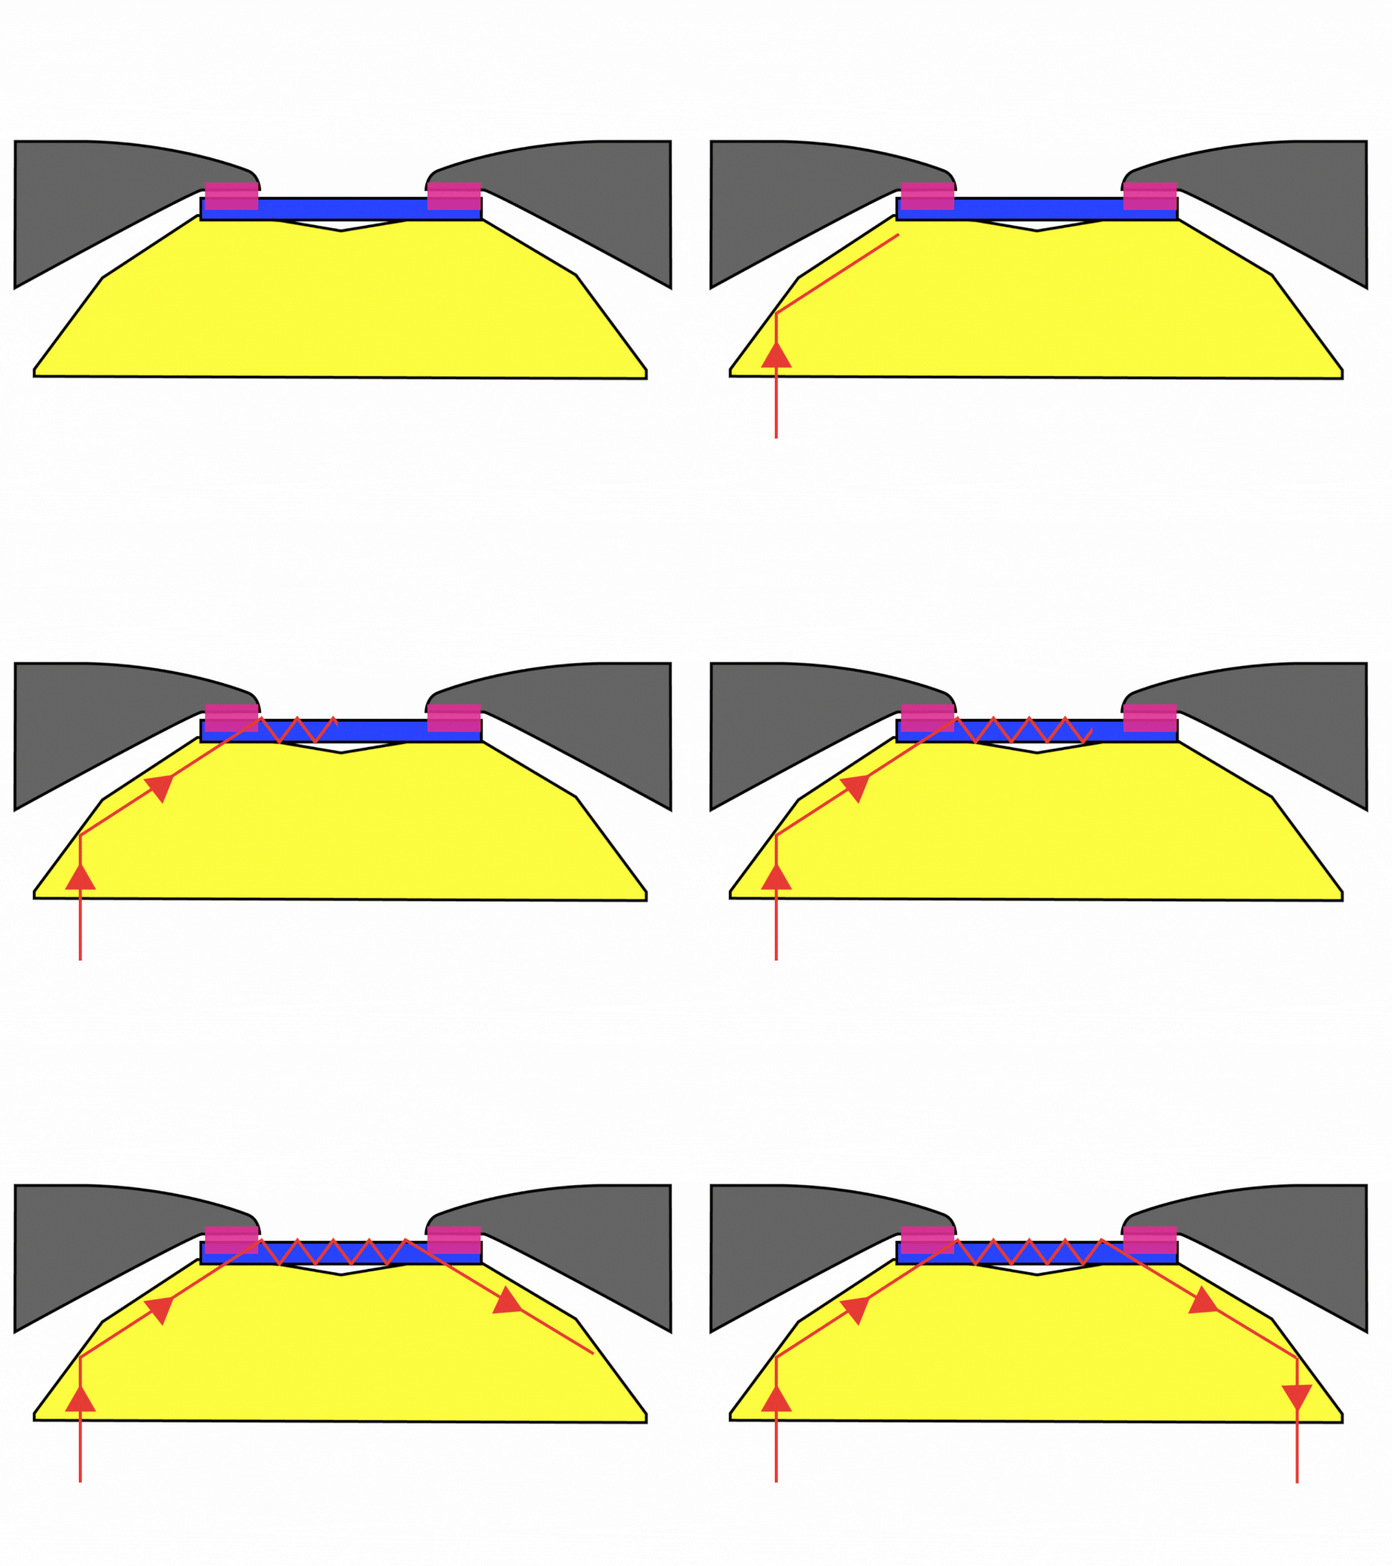
A great new addition to the Specac portfolio is the ConcentratIR2™ from Harrick. It offers the enhanced sensitivity of multiple-reflection ATR, concentrated in a very small sampling area. It is best used where analysis of microvolumes of liquids, pastes, slurries with high sensitivity is required. It’s ideal where there is limited availability of sample or where it is high in value.

Key features
- Requires only 10 μl of sample. Sensitive to concentrations of 0.5 mg/ml and lower.
- 10 or 11 reflections at the sample, depending on choice of ATR material (diamond or silicon).
- Flow cells and heated cells available.
References
- Kapoor, S., Triola, G., Vetter, I.R., Erlkamp, M.,Waldmann, H., and Winter, R., PNAS, 109, (2012), 460-465.
- Kapoor, S. Weise, K., Erlkamp, M., Triola, G., Waldmann, H., and Winter, R, J. Eur. Biophys., 41, (2012), 801- 813.
- Byler, D.M., and Susi, H., Biopolymers, 25, (1986), 469–487.
- Specac application note AN18-06: Protein Conformational and Structural Changes.
- https://en.wikipedia.org/wiki/Ras_GTPase. Accessed 08/11/2024
- https://www.spectroscopyeurope.com/td-column/back-basics-spectral-pre-treatments-derivatives. Accessed 08/11/2024